
2021 Cyber Weekend Preliminary Insights
23rd Nov, 2021

By Amy Fieber
The exponential growth of eCommerce has forever changed holiday shopping as we know it. What was once led by the launch of Cyber Monday in 2005, has since expanded to ‘Cyber Five’ in 2018, now spans beyond an eight-week period, and is collectively the busiest digital shopping period of the year. Most retail websites have launched a ‘Thanksgiving Comes Early’ sales event for a mosaic of products, causing one to wonder how this ‘early start’ to holiday shopping will impact the traditional promotional cadence consumers have grown to expect to see launch closer to the holidays. Given today’s environmental challenges, threats of scarcity are also encouraging consumers to buy early, which could also impact traffic on the shopping days that have traditionally seen the highest sales volume from digital shoppers.
In the current environment, the onus will be on consumers to keep a watch for their categories of interest and buy them as and when they appear on sale in their favorite store, because there is no guarantee of sustained availability. Of course, they might return and buy at a different store if a better deal comes up, but there’s a time cost for the dollars saved. More broadly, there has been enough noise made about deals and discounts to keep consumer interest and curiosity going.
The early promotional start and heightened demand has influenced our team to get a jump start on our 2021 Black Friday analysis to look deeper at trends seen pre-Black Friday 2021 versus 2020. With this assessment, we can track how promotional prices and product availability rates may have changed throughout the event leading in to 2021 Cyber Five, and compare it to last year’s activity to understand how 2021 holiday sales may be impacted.
We reviewed popular holiday categories like apparel, electronics, and toys (for kids and pets), to have a broad sense of notable trends seen consistently throughout various, applicable marketplaces. What we found is a consistent decline in product availability over the last six months and as compared to last year, alongside an increase in prices.
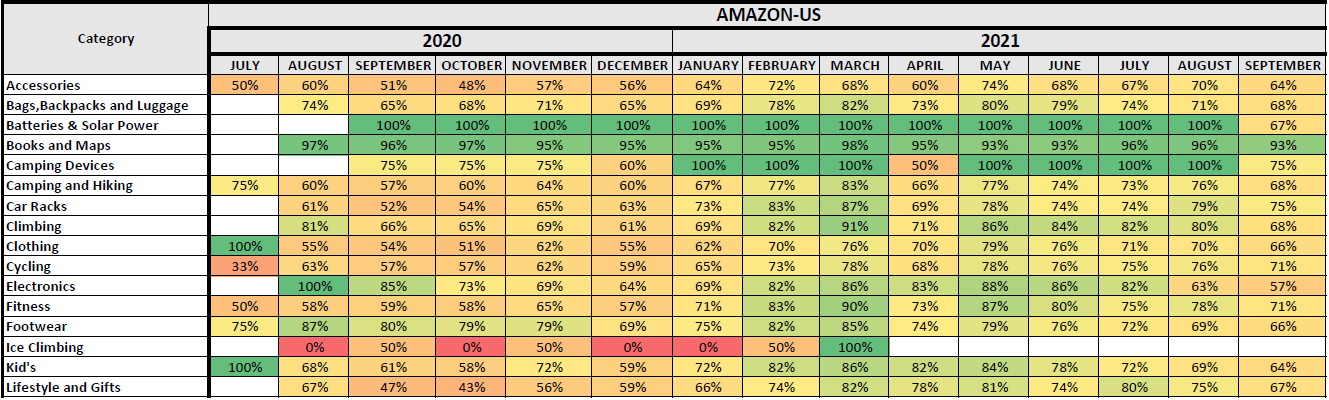
We first analyzed availability changes for popular categories on Amazon, noted in the chart below, to understand how inventory may have changed throughout the year, and also compared to 2020. With the exception of batteries and solar power goods and books and maps, there appears to be consistency in greater product availability in 2021 versus 2020, but a slow decline in availability throughout 2021, leading into the holiday season.
When it came to our pricing analysis, we reviewed select categories on Amazon and Target.com, and found around fifty percent of products on both websites to have seen a price increase year-over-year, while only thirty-seven percent and sixteen percent of products saw a price decrease on Amazon and Target.com, respectively. We also see an increase in the manufacturer’s retail price (MRP) in 2021 versus 2020 for a very high proportion of products (forty-eight percent of products on Amazon and thirty-five percent of products on Target.com), but the discount percentages have remained the same.
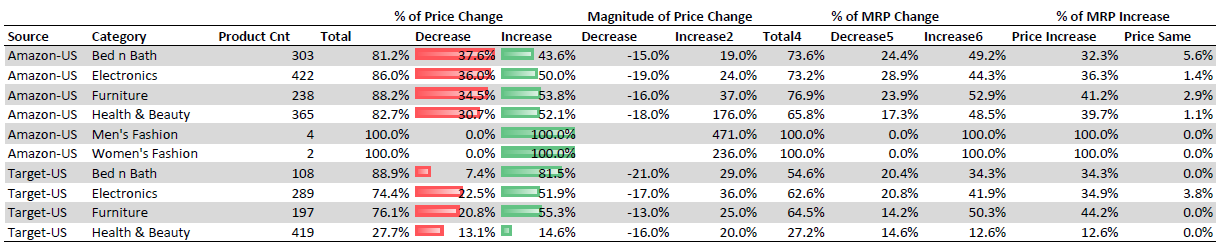
*Please reach out to our Retail Analytics experts for access to sub-category details available within the above analysis conducted on Amazon and Target.com.
This indicates 2021 discounts may appear to be greater than or equivalent to 2020, but in reality, consumers will end up paying higher prices than they would have for the same items in 2020. The remainder of this article highlights our key findings found within each key category reviewed – Electronics, Apparel and Toys.
Electronics Category Analysis
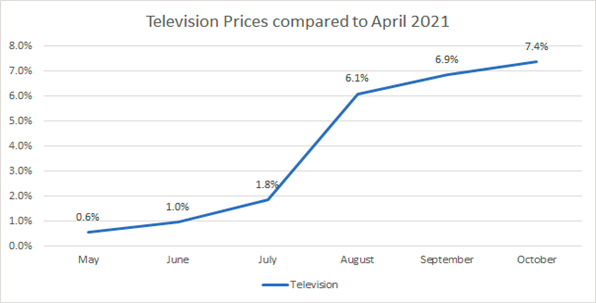
The television category showcases a great example of how pricing fluctuations impact holiday promotional cadences. Based on our analysis, we found the average television price to have increased around seven percent from April to October 2021, as seen below and as noted within our analysis conducted with NerdWallet.
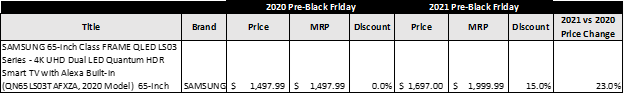
In fact, on Amazon and Target.com, we see around eighty-four percent of the SKUs listed show both an MRP and promotional price increase in 2021 versus 2020 during pre-Black Friday times. One specific example found on Amazon is noted below for Samsung TV model QN65LS03TAFXZA, a 65 inch QLED TV that was priced at $1697 during this analysis at a fifteen percent discount from MRP, but was priced last year at $1497 without a discount from MRP. In essence, even though the TV offers a greater discount this year, it is actually more expensive than it was in 2020 at this same time of year.
Unlike TVs, the price of laptops has experienced a decrease over time based on our analysis conducted during the same timeframe, indicating these are a great buy for consumers this holiday season versus promotional offers seen in 2020.
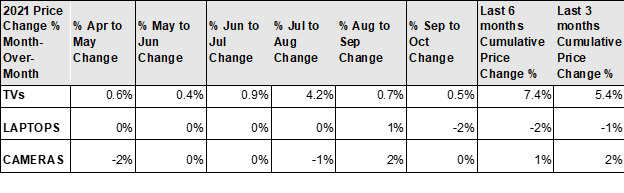
Overall, our prediction is that within the electronics category, promotions during Cyber Five may be equivalent to last year’s offers, however, supply will be limited and the total spend versus last year will be greater to the consumer outside of Doorbuster deals offered on select models.
Apparel Category Analysis
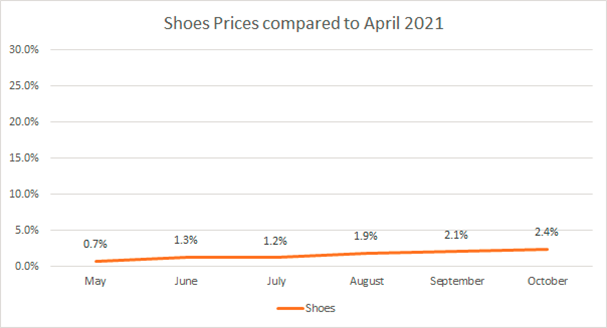
The Luxury market is seeing a Roaring 20s-like feeling this season given the Covid-induced changes in work and lifestyle and higher disposable income. Therefore, our prediction is that prices for these goods are likely to remain flat, or offer very little discounts this season both due to supply constraints as well as higher demand. For example, our analysis on shoe pricing changes shows relative stability from April to October 2021.
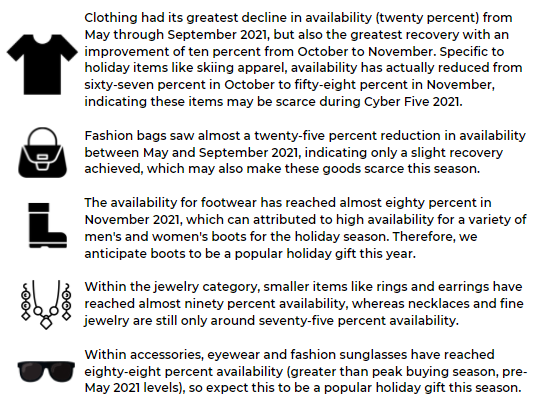
Given heightened demand and the Global shipping crisis, we anticipate luxury apparel categories to face out-of-stock challenges this holiday season, and therefore we also anticipate seeing less promotional activity for these items as well during Cyber Five 2021. To dive deeper into the severity of the impact, we looked at availability for clothing, accessories, and footwear categories from August 2020 until present to verify our thesis.
Focusing only on clothing, accessories, and footwear, these categories followed the same downward trending pattern regarding product availability decreases this year with a decline from June (seventy-six percent versus eighty-six percent in May 2021) to September 2021 (the lowest rate seen at sixty-eight percent availability), followed by a partial recovery in October and November (achieving seventy-seven percent availability).
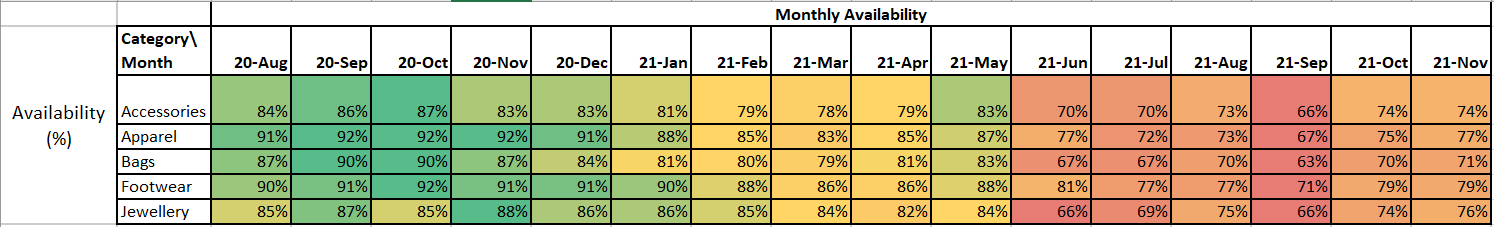
Not all recoveries were the same however, and given this, we predict accessories to have the lowest availability rate and greatest risk of facing out of stocks heading into Cyber Five. From May through November 2021, accessories availability continued to decline significantly from month to month, beginning at eighty-three percent in May and ending at seventy-four percent in November. Given this continued decline and with Black Friday right around the corner, we don’t anticipate inventory levels to increase enough to meet the increased holiday demand.
Toys & Games Category Analysis
As noted by DigitalCommerce360, we also anticipate toys to be one of the greatest impacted categories this holiday season given the continued decline in overall availability for these items on Amazon.com, as one great example. Within our category analysis, we saw a steady decline in availability from March 2021 through June (eighty percent to sixty-one percent), followed by a period of stability from June through August (approximately sixty percent), followed by another decline from September through October, finally reaching the lowest availability of fifty-six percent (down twenty-four percent from March 2021).

The biggest sub-category within the toys department on Amazon, Sports and Outdoor Play, followed the same trend as Toys and Games overall through June 2021, also reaching its lowest availability of fifty-six percent. Instead of continuing along that pattern, Sports and Outdoor Play started on a recovery path, ending at a relatively high availability level of sixty-seven percent in October, which is only five percent lower than its highest availability (seventy-two percent in March 2021). Games and Accessories, the second largest sub-category in Toys and Games, had a continuous decline starting with eighty-nine percent in March 2021, reaching its lowest availability of fifty-four percent in October.

The sub-category Tricycles, Scooters and Wagons interestingly had its highest availability from July to September 2021 (around eighty percent), unlike other sub-categories which as a whole, had their lowest availability during the same timeframe. From September through October, there was a significant decline (fourteen percent), reaching its lowest availability of sixty-seven percent. The sub-category Babies & Toddlers started on a continuous decline from its highest availability of eighty percent in April to its lowest availability of fifty-six percent in October.

*Please reach out to our Retail Analytics experts for access to sub-category details available within the above analysis on the Toys and Games category on Amazon.com.
Pet Toys Category Analysis
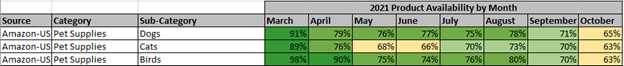
When it comes to in demand holiday toys, you can’t forget about the needs for gifts for our furry friends and family. We also tracked sub-categories such as dog, cat, and bird toys, following the same methodology as tracked within Toys and Games to track pet toy availability changes.

Dog toys, the biggest sub-category out of the three pet toys analyzed, had high availability – ninety percent in March 2021, but started to decline reaching a low of sixty-five percent in October. There was a period of stability from April to August (averaging seventy-seven percent), followed by a significant decline of over thirteen percent in from September to October. Cat toys, the second largest sub-category, also had its highest availability in March (eighty-nine percent) followed by a steady decline to sixty-six percent in June, a recovery from July to August (achieving seventy-three percent), followed by another decline during September and October, reaching its lowest availability of sixty-three percent (down twenty-six percent from eighty-one percent in March). Interestingly, dog toys which has a product count eight times greater than cat toys, had higher availability than cat toys during each of the months considered during the analysis.
In Conclusion
If we consider discounts and availability to be a good indicator of sales for the 2021 holiday season, with the Global shipping crisis looming over this year’s event, we expect retailers to have trouble keeping their inventory well stocked, which might affect growth rates. That being said, while discounts may be muted and popular items may come on very limited sales given constraints, we believe digital sales on Black Friday will see the highest year-over-year growth to date, given a number of supporting factors: scarcity threats increasing demand and the reason to buy, and consumers waiting to see if holiday offers surpass those see in the early start promotions, followed by the sudden rush to buy on Black Friday so as not to risk a given product being out of stock beyond this time period.
We also anticipate seeing a continued decline in product availability day-to-day as we progress throughout Cyber Five 2021. Given the analysis conducted on 2020 trends, (we tracked nearly a one percent decline in availability on Black Friday 2020 vs. Thanksgiving Day, followed by a two percent decline on Cyber Monday), our data indicates products went out-of-stock at a faster rate then also.
Ultimately only the digital-savvy retailers and brands will thrive during these opportune times, while others will continue to be in catch-up mode. Access to real-time marketplace insights can enable a first-to-market strategy, while having access to historical patterns can also help react faster to commonly seen future market factors, such as another pandemic or Global shipping crisis. These types of insights also support day-to-day operations, enabling retailers and brands to accelerate eCommerce growth, determine systems to distinguish their online strategies, discover efficiencies and drive profitable growth in an intensifying competitive environment.
Continue to follow us in the coming weeks to see the insights we track through Cyber Five 2021, and be sure to reach out to our Retail Analytics experts for access to more details regarding the above analysis.


Book a Demo
Login
For accounts configured with Google ID, use Google login on top.
For accounts using SSO Services, use the button marked "Single Sign-on".