
From Mess To Match: Solving Product Identity At Retail Scale
1st Jun, 2026

By Sadananda Vaidya
Following our first post on building the ideal retail data lake foundation, this second instalment dives into the next critical challenge: solving product identity at scale.
The same product shows up as “Nike Air Max 90, Men’s, Size 10, White” on one site and “NIKE AIRMAX90 WHT MEN SZ10” on another. A 16 oz bottle of detergent gets listed as “16 FL OZ” in one feed and “1 PT” in another. Brand names shift between “United Colors of Benetton,” “UCB,” and just “Benetton.” Multiply this across millions of SKUs, dozens of data sources, and daily refresh cycles, and you have a picture of what retail data actually looks like before anyone cleans it up.
This is the normalization problem. And it is the single biggest obstacle standing between retail organizations and the AI-driven future they keep hearing about at conferences.
This second post in the series is about how a competitive intelligence platform should solve that problem, what the traditional approaches get wrong, and why the cost of getting it wrong has gone up sharply in the last twelve months.
The Traditional Approach, and Where It Breaks
The textbook’s first attempt at product matching uses identifiers. Match on UPC, GTIN, EAN. It works some of the time. Online retailers routinely omit identifiers, use their own internal SKUs, sell repackaged regional variants without barcodes, or list multipacks with the unit code instead of the bundle code. Identifier matching produces high precision when it works, and silently misses a large fraction of the catalog when it doesn’t.
The textbook second attempt is title-string matching. Tokenize the title, normalize case, strip stop-words, fuzzy-match. Also brittle. The same product is described in dramatically different ways across retailers. Retailers cross-sell their private label using titles that mimic name brands. Two completely different products often share words that look meaningful, for example “premium denim straight-fit” can describe dozens of distinct SKUs.
Product matching sounds simple until you realize it isn’t one problem. It’s many.
An exact match identifies the same product across different retailer sites — the Nike Air Max 90 on Foot Locker’s site and the same shoe on Dick’s Sporting Goods. Exact matching is most common in categories with strong identifiers — national brands in electronics, baby and personal care, packaged goods with UPCs. When the data is clean and identifiers are consistent, exact matching can reach 95%+ accuracy.
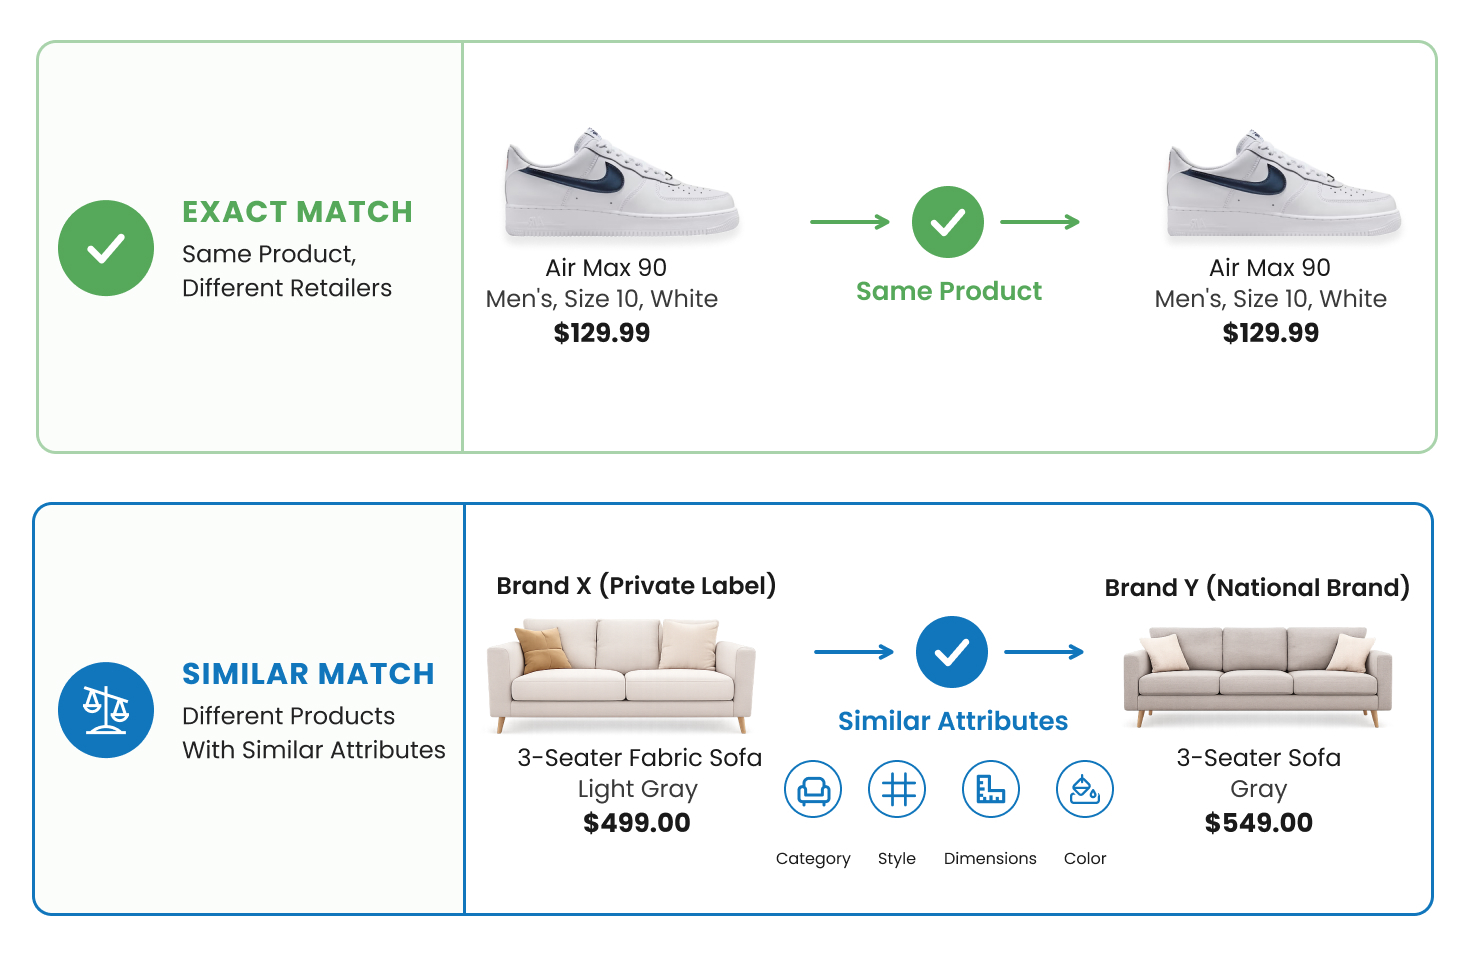
A similar match is the harder case. It identifies products that share key attributes but aren’t identical. The match is defined by a combination of “fixed” attributes (non-negotiable criteria like product category) and “flexible” attributes where some tolerance is acceptable, such as price band or specific features. Two mid-rise straight-leg jeans in similar fabrics and price points might count as “similar” for competitive pricing, even if one is a private label and the other is a national brand. Similar matching is the critical case for local brands, private labels, and categories like furniture, home furnishings, and hardware appliances, where no two competing products are ever truly identical.
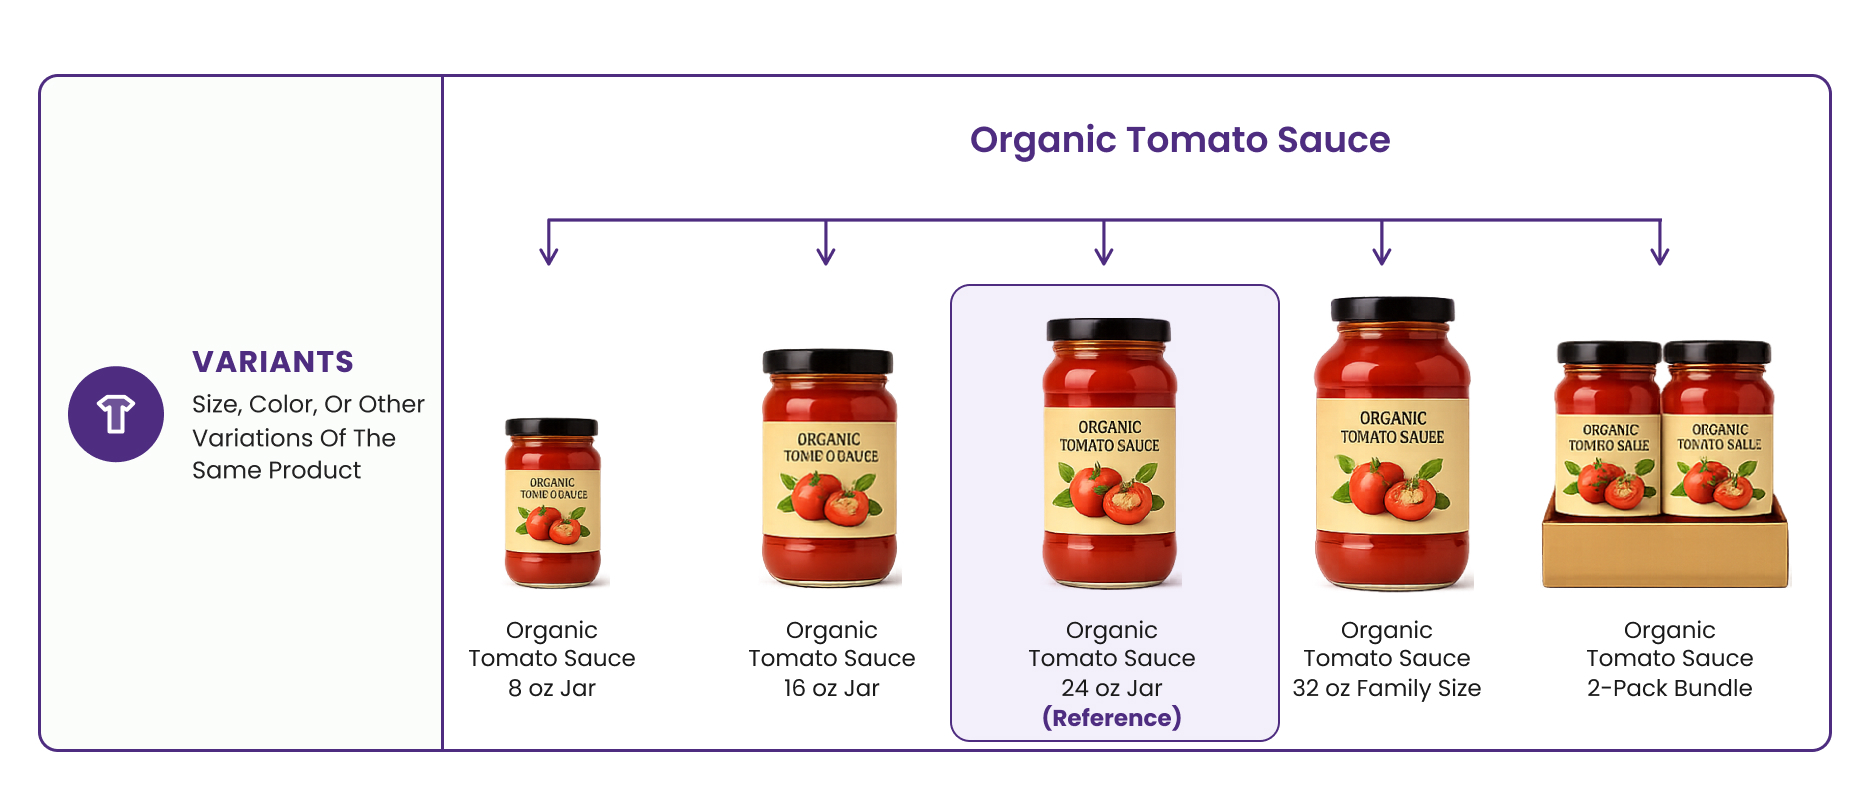
Matching also extends to variants (a size or color variation of a reference product), substitutes (a product that could replace another), competitor matches (Adidas vs. Nike vs. Asics running shoes), basket matches (bundles instead of individual items, common in grocery and CPG), and even counterfeit detection.
Why this matters: the AI required for each match type is different. Exact matching is largely identifier resolution and text normalization. Similar matching demands multimodal reasoning, domain-specific similarity criteria, and tolerance thresholds that change by vertical and by use case. Any platform that treats them as the same problem will produce confidently wrong results.
The Vertical Problem
In apparel, match rates typically sit between 40% and 60%, compared to 95% in electronics. Similarity is subjective. This means it depends on style, color, gender, fabric, texture, dress length, neck type, sleeve length, and more. Size charts vary by brand, country, and style. Fast-fashion brands launch new styles constantly, creating a moving target. Product descriptions are often ambiguous or incomplete, and combination products (a suit sold as a set versus jacket and pants sold separately) complicate the count further. Pricing intelligence also has to distinguish between first-party retailers with consistent brand pricing and third-party sellers who introduce price variability.
In grocery, UPCs and PLUs exist but aren’t displayed consistently. Private label products use retailer-specific UPCs that don’t map across competitors. The same product appears in different pack sizes and formats. Produce has regional names. Commodity items carry different brand names across countries. Internal product relationships — value sizes, brand tiers, price links between variants like flavors or scents — need to be maintained so that price changes cascade correctly across the portfolio.
In home improvement, dimensions are the key linking attribute. A 4-inch versus a 6-inch recessed light fixture isn’t a “variant” the way a blue versus red shirt is. It is a different product for a different use case. The attribute logic that makes that distinction is specific to the vertical.
The conclusion is uncomfortable for a generic ML team — normalization cannot be a generic data-cleaning exercise. The system has to carry the retail context of every category it processes.
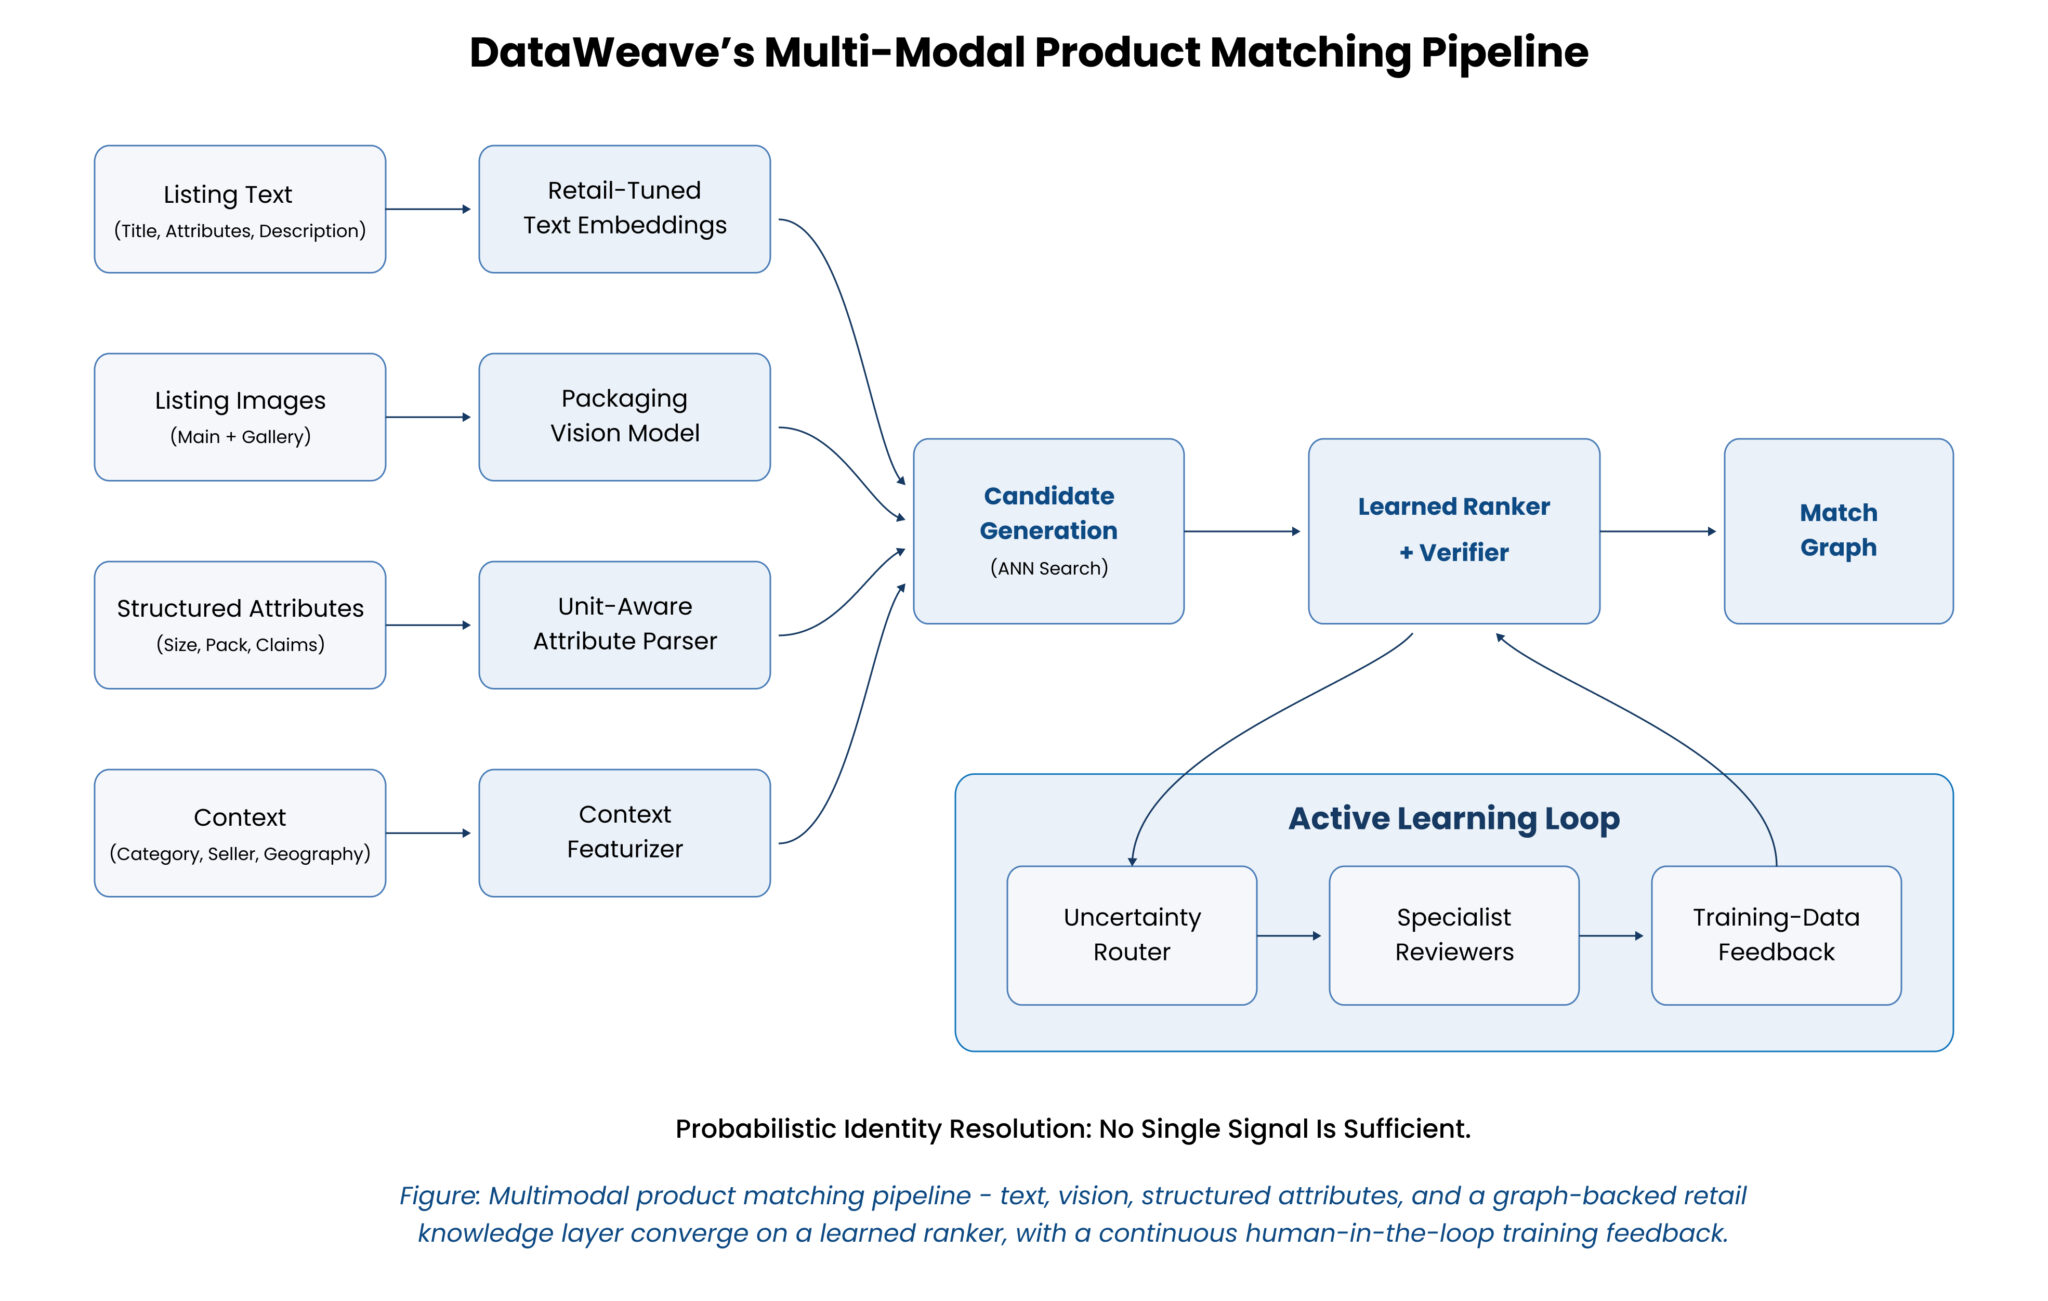
Inside A Multimodal Matching Pipeline
A working retail matching pipeline looks roughly like this.
Ingestion at scale: Crawlers harvest 100–200 million data points daily from retailer websites and mobile apps. The crawl infrastructure uses AI-powered bot evasion to maintain a 99%+ success rate against modern anti-bot defenses, with self-healing logic that adapts when site layouts change. Clean, structured output (JSON, CSV) is delivered to cloud environments like AWS S3, Snowflake, or GCP.
Text pre-processing and attribute extraction: Titles, descriptions, and structured metadata are parsed. Stop-words and noise are removed. Named entity recognition identifies key elements. LLM-based extraction pulls attributes out of messy descriptions. “Apple iPhone 12 Pro Max 128GB Pacific Blue Unlocked” decomposes into brand (Apple), product family (iPhone 12 Pro Max), storage (128GB), color (Pacific Blue), and carrier status (Unlocked).
Attribute normalization and domain enrichment: “RAM” resolves to the same attribute as “Memory.” “16 giga bytes” maps to “16 GB.” Brand names get unified (“P&G” = “Procter & Gamble”). Size representations get standardized using brand-specific and retailer-specific charts. Units of measure are converted using regex patterns and curated rules. Taxonomy hierarchies are aligned through encoder-decoder models and zero-shot classification. All this domain knowledge lives in a continuously updated graph store of structured relationships between products, brands, manufacturers, categories, and attributes, not a static reference file.
Multimodal matching: On the text side, transformer embeddings capture semantic similarity, and LLMs identify implicit relationships that rule-based systems miss. On the image side, the pipeline pre-processes product images (face and skin removal, background removal, object detection), then extracts visual features like color histograms, shape vectors, deep-learning features and uses CLIP embeddings, Siamese networks for pairwise scoring, and CNN-based global features to compare products photographed under wildly different conditions. The platform has indexed over 100 million images with these visual features. For similar matching, the engine applies vertical-specific similarity criteria with configurable tolerance levels and produces a confidence score for every result.
Auto-processing and human-in-the-loop: Close to 90% of matches are auto-processed, either auto-verified at high confidence or auto-rejected when clearly not a match. The remaining edge cases route to specialist human reviewers. Every decision becomes a new training example. Over time the platform has built a reusable database of more than 40 million verified product pairs, with three to five attributes tagged per product. Since the introduction of LLMs and CLIP embeddings, match accuracy has improved by more than 15% from baseline in home improvement, fashion, and CPG, with precision exceeding 85% in electronics and fashion.
The Half of The Story Most People Miss
Most conversations about product matching stop at “the same product or not.” The harder work, and the work that compounds, happens in attribute tagging.
Deep-learning-driven attribute extraction goes well beyond brand, size, and color. The system applies industry-specific tagging logic: in fashion, it extracts neck type, pattern, sleeve length, pocket presence, and fabric composition. In grocery, it reads nutrition tables and detects certification marks. In home furnishings, it captures physical dimensions. It handles synonyms (“denim” = “jeans”) and can extract visual attributes from product images that aren’t present in the text. Attribute tagging accuracy exceeds 75% for the top five categories and continues to improve as the feedback loop matures.
Why does that matter to a brand reader? Because attributes drive every downstream metric. Competitive pricing comparisons need unit-of-measure normalization. Assortment gap analysis needs consistent category and subcategory tagging. Content audits need attribute completeness scores. Search visibility analysis depends on whether the right keywords sit in the right attribute fields. Get the attributes wrong and every chart on every dashboard tells you something subtly false.
This is the intelligence layer. In the next and final post in this series, we’ll connect this matching engine to the layer most users actually see: the dashboards, the self-serve tools, and, increasingly, the AI agents making competitive decisions on a brand or retailer’s behalf.
Building on the core pipeline architecture we discussed in part one, this normalization process is what ultimately makes your data actionable. If your organization is struggling to bridge the gap between messy multi-retailer feeds and clean, AI-ready product definitions, reach out to us to see our multimodal matching engine in action.


Book a Demo
Login
For accounts configured with Google ID, use Google login on top.
For accounts using SSO Services, use the button marked "Single Sign-on".