
Amazon Prime Day 2026: Which Categories Ran Deepest and Which Brands Cut Hardest
2nd Jul, 2026

By DataWeave Marketing
The Prime Day conversation so far
Amazon Prime Day 2026 was one of the largest shopping events of the year, and the coverage reflected it. Amazon ran the sale across a four-day window from June 23 to 26, its longest format yet. TheStreet reported that online spending reached $8.3 billion on the first day alone, the biggest e-commerce day of 2026 to that point, with Adobe forecasting $26.3 billion across the full event.
Most of the coverage focused on two questions: how much people spent, and what that spending says about the US consumer. CNBC noted that shoppers leaned into essentials and back-to-school items, and that discount levels were broadly in line with last year, with consumer electronics and apparel both averaging around 24% off according to Adobe.
Those are useful numbers, and they hold up. What they leave out is the detail underneath: how discount depth moved by category, which brands discounted hardest, and what the steepest discounts were actually made of. That is the view this analysis adds, measured product by product across Amazon’s catalog.
Our methodology
Between June 23 and 25, DataWeave tracked live pricing on 11,620 in-stock Amazon US products. The sample spanned 67 search listings across 9 key categories: Apparel, Consumer Electronics, Floor Care and Air Quality, Gaming, Health and Beauty, Home and Furniture, Kitchen Appliances, Smart Home and Devices, and Sports and Outdoor. For each keyword search we captured the top 150 to 200 SKUs by search rank.
For every product we recorded the manufacturer list price and the lowest available price seen during the window, then calculated the discount. We kept only products that were in stock and carried both a list and an available price. Every figure that follows is drawn from this dataset.
The shape of the discounts
Ahead of the event, Amazon’s preview promised savings of up to 40% on fashion and up to 30% on consumer electronics and beauty. Those figures describe the ceiling. Measuring the full catalog shows where the typical product actually landed.
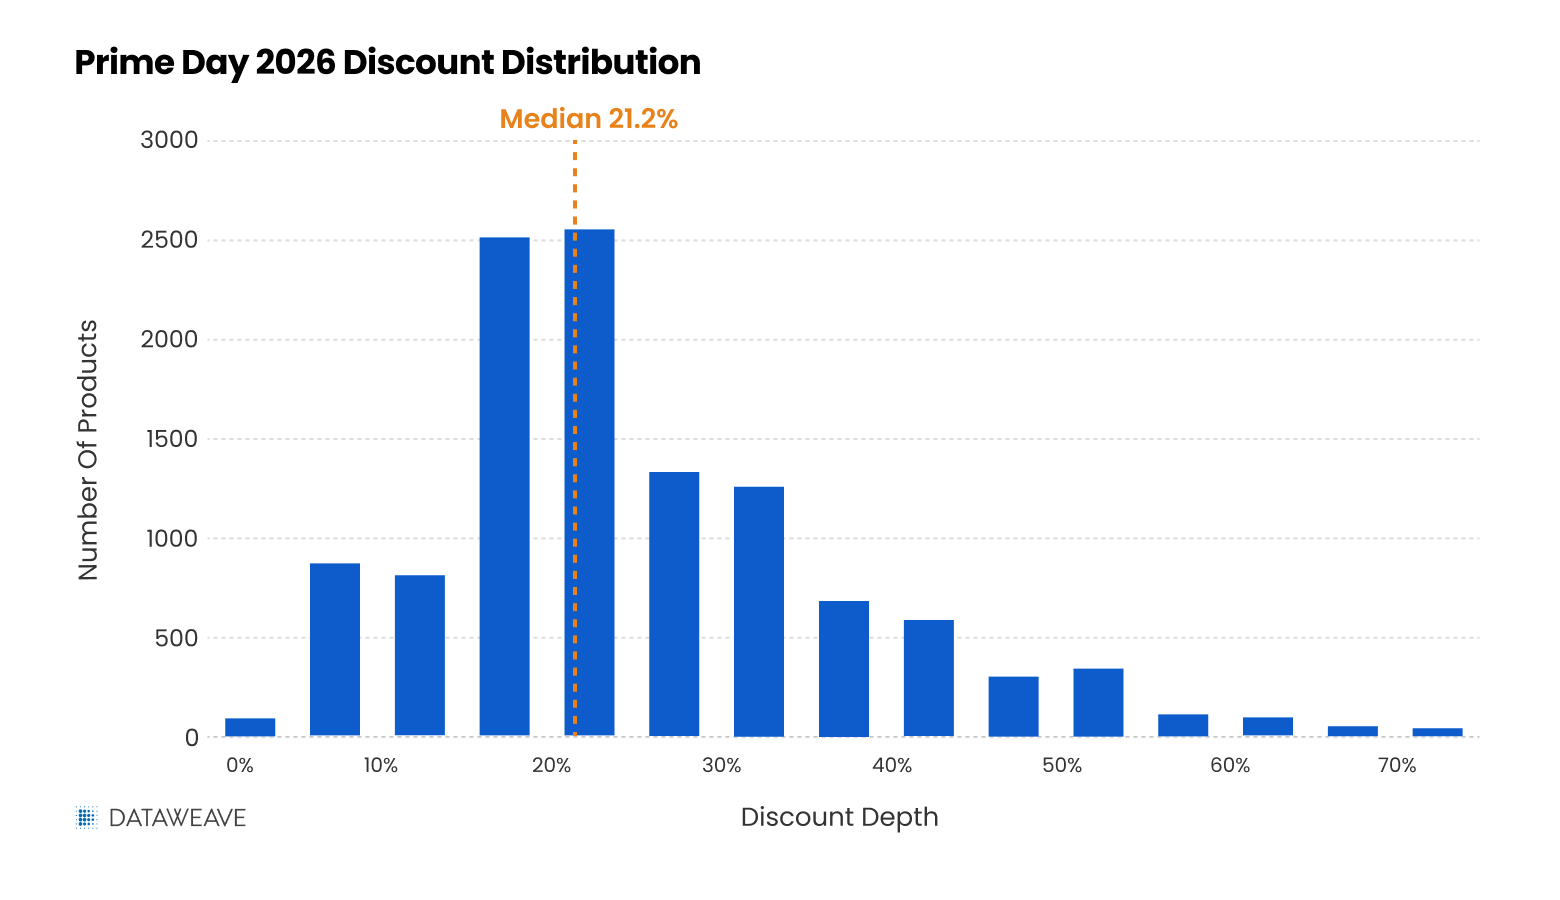
Across all 11,620 products, the average discount was 24.6% and the median was 21.2%. Discounts clustered firmly below 30%, with a long thin tail of deeper deals stretching toward the headline numbers. The large “up to” figures pointed to the best deals available, not the typical one, which is exactly how a headline discount is designed to work. Measuring every product fills in the rest of the curve.
Where the discounts ran deepest
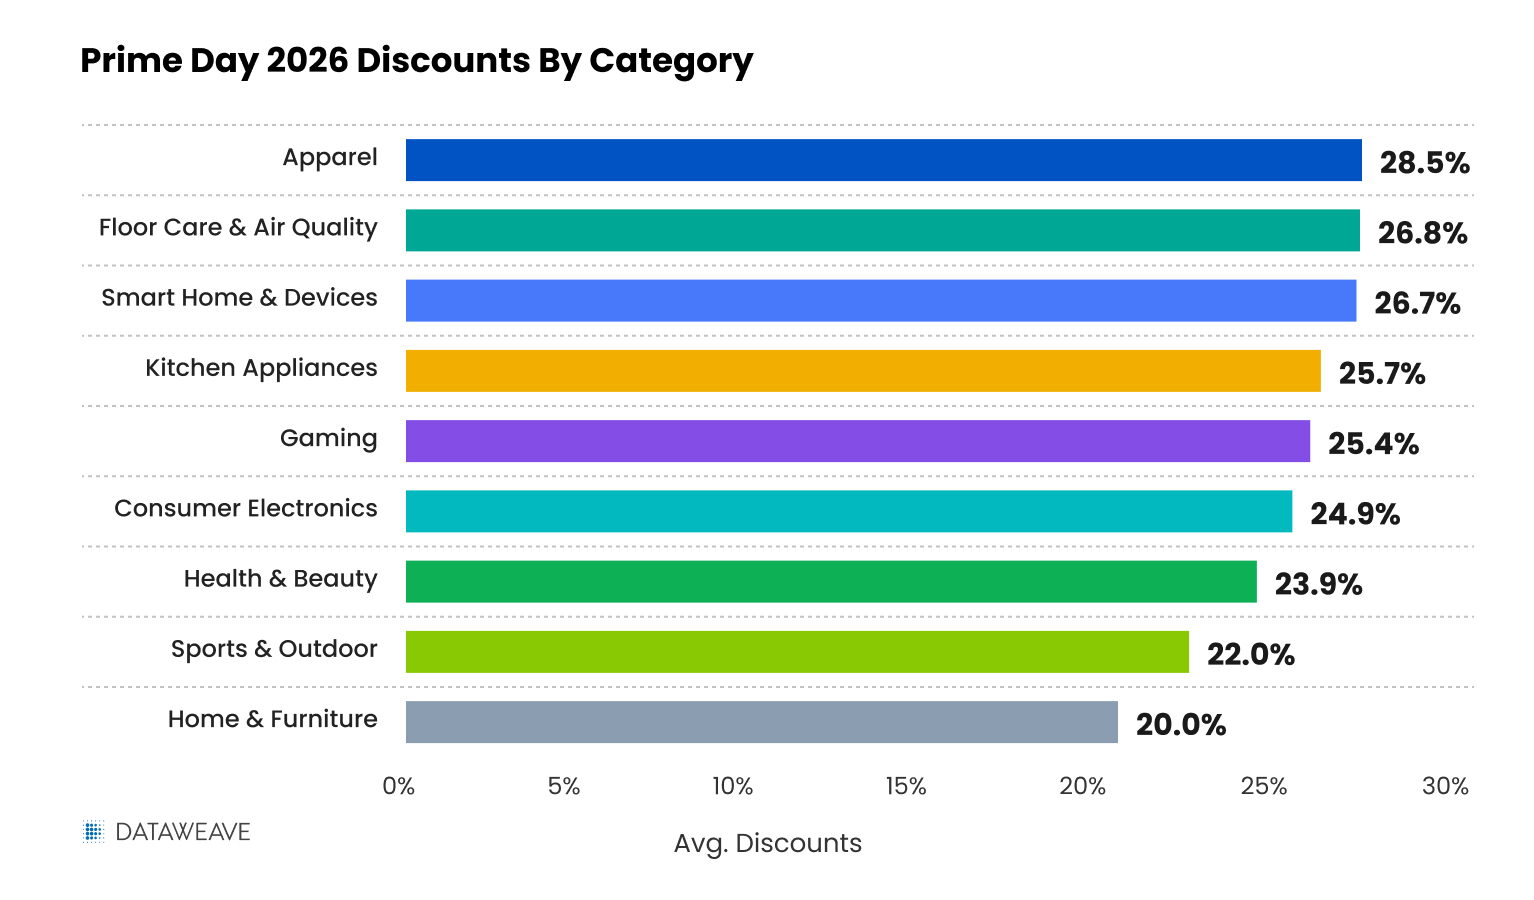
What you were shopping for mattered. Discount depth varied by nearly ten points from the deepest category to the shallowest.
Apparel was the deepest category at 28.5%, followed closely by smart home. Home and furniture saw the lightest discounting at 20.0%, which fits a pattern common to large sales: bulky, lower-velocity goods tend to move less on price. The categories tied to Amazon’s own devices and to seasonal demand, smart home and apparel, were where the catalog discounted most aggressively.
The brands that discounted hardest
Within each category, the depth of discounting was uneven from brand to brand. Ranking the recognizable, well-reviewed brands by their average discount shows where the most aggressive promotions sat among names shoppers actually know.
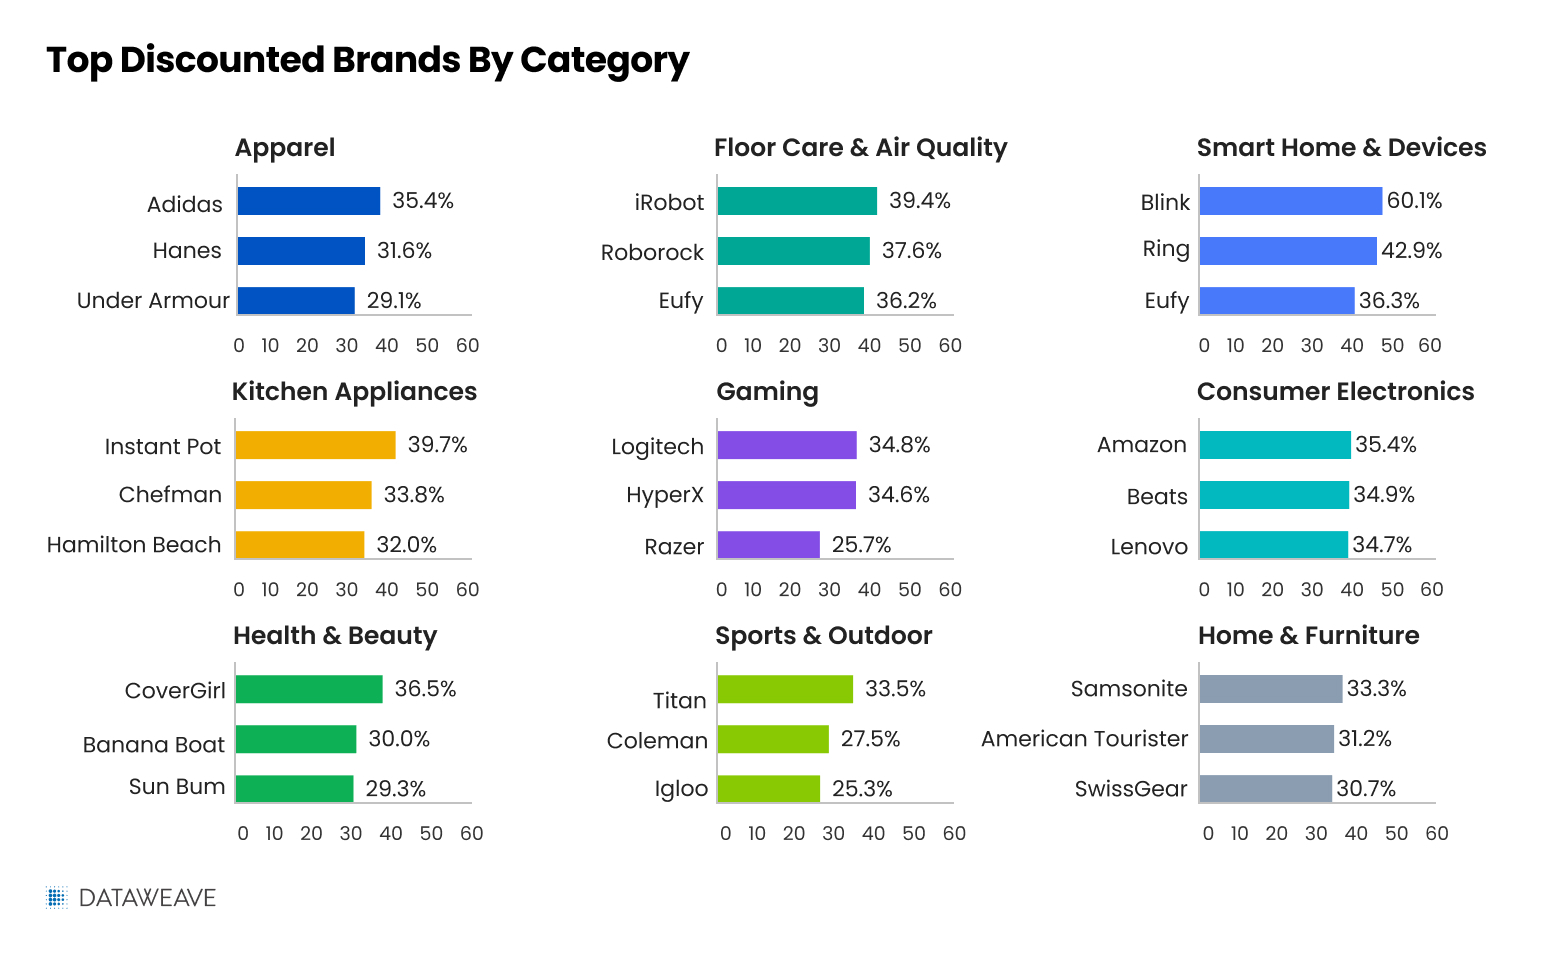
A few patterns stand out:
- Amazon’s own smart-home brands led the steepest discounting anywhere: Blink averaged 60% off and Ring 43%, the deepest brand-level cuts in the study, with Eufy close behind at 36%. This lines up with Amazon’s stated plan to take up to 50% off its own devices, and it shows up clearly in the data.
- Household names anchored every category: Adidas, Hanes, and Under Armour led apparel. iRobot, Roborock, and Eufy led floor care. CoverGirl, Banana Boat, and Sun Bum led health and beauty. Logitech, HyperX, and Razer led gaming. Instant Pot, Chefman, and Hamilton Beach led kitchen. Samsonite, American Tourister, and SwissGear led the travel goods within home and furniture.
- Consumer electronics discounting was broad but moderate among the leaders: Amazon’s own consumer electronics, Beats, and Lenovo all clustered around 35%, below the steep cuts seen on smart-home devices.
The pattern is that the deepest brand-level discounts among recognizable names were concentrated in connected devices and robot vacuums, while everyday categories like apparel and consumer electronics discounted more evenly across their leading brands.
What the deepest discounts were made of
The very steepest discounts in the catalog tell their own story, and it is one that applies to any large online marketplace.
A discount percentage is only as meaningful as the list price behind it. Among products marked 50% off or more, the large majority came from smaller or lesser-known sellers rather than established national brands. In the data, 94% of the 50%-plus discounts sat with unfamiliar brands. This is a structural feature of marketplaces where third-party sellers set their own reference prices: a high reference price produces a large percentage even when the final price is ordinary.
Established brands behaved differently. In consumer electronics, recognizable brands averaged a 22.2% discount, slightly lower than lesser-known products, because their list prices were stable to begin with. With those brands, a smaller percentage often represented a more dependable saving.
Prime Day 2026 also delivered genuinely strong deals from familiar names. A sample from the data, all from established brands with credible reference prices:
- iRobot Roomba 105X robot vacuum, 56% off, $450 down to $200.
- Shark Matrix robot vacuum, 55% off, $599 down to $270.
- Sony WH-CH720N noise-canceling headphones, 54% off, $180 down to $82.
- Instant Pot Vortex Plus air fryer, 54% off, $130 down to $60.
The signal in the data is that the size of the discount badge and the size of the real savings are not always the same number. Reading the catalog accurately means weighing the discount against the seller and the product’s real price, not the percentage alone.
Coming next in this series
The next piece in this series turns to visibility. We rank the brands that won the highest share of search across Prime Day queries, then set those Amazon search leaders against the brands surfacing across AI interfaces like ChatGPT, Perplexity and Claude. The two lists rarely match, and as more product discovery moves to AI, that gap is where brands will see whether their shelf presence carries over or falls away.
For ongoing analysis of pricing, promotion, and visibility across the digital shelf, stay connected to the DataWeave blog, or reach out to us to see how this intelligence maps to your categories.


Book a Demo
Login
For accounts configured with Google ID, use Google login on top.
For accounts using SSO Services, use the button marked "Single Sign-on".