
Pricing Intelligence in the Age of AI-Driven Commerce: Price Now Drives Discoverability, Not Just Conversion
29th Jun, 2026

By Shailendra Nagarajan
Pricing has always carried the same underlying goal. Make sure that when a shopper is deciding what to buy, your price is working in your favour. That has not changed and it will not change. What has changed is the shopper, or more precisely the path the shopper now takes to a decision. The buyer journey looks almost nothing like it did three years ago, and because it has changed, the role pricing intelligence plays in winning the sale has changed with it.
For most of ecommerce history, the journey was something a person did with their own attention. They searched, they opened a few tabs, they compared two or three options, and they chose. Pricing intelligence existed to make sure that when a shopper reached your product, your price held up against the handful of alternatives they were realistically going to check. Get within range of the competitors a shopper would actually see, and price did its job.
The shopper has now handed most of that work to a machine. And the machine does not open three tabs.
Price Used to Decide the Sale. Now It Also Decides Whether You’re in the Running.
Here is the shift, stated plainly, because everything else follows from it.
Price used to be a conversion signal. Once a shopper found your product, the number influenced whether they bought it. Now it is also a discoverability signal. Before a shopper ever sees your product, an AI system has already weighed your price, together with everything else it can read about your product, and decided whether you are worth showing at all.
These are two different jobs, and the second one is new. If your price loses the discoverability test, the conversion test never happens. You are not losing the sale at the checkout. You are losing it before the shopper knows you exist.
To be fair, price is not the only thing these systems weigh. Availability, ratings, content quality, and delivery speed all feed the same judgement, and a great price cannot rescue a product that is out of stock or poorly described. But price is the lever a pricing team most directly controls, and it has quietly taken on a second role at the front of the journey. The old standard, “be competitive against the rivals a shopper would check,” no longer protects you, because the shopper is not doing the checking. An AI system is, and it checks far more than any person ever would.
The Field You’re Being Compared Against Is Far Wider Than the One You Track
Earlier, when a person comparison-shopped, the competitive set was capped by practical limits. Nobody opens forty tabs. A shopper checked the two or three names they already trusted, maybe a price-comparison site, and stopped. So a pricing team could track those same few competitors and reasonably claim to see what the shopper saw. The tracking list and the shopper’s consideration set were roughly the same size.
AI removed the cap. When a shopper asks an assistant to find the best option, the system does not check three merchants. It evaluates every merchant it can resolve a product and price for, across the entire feed it draws on, in a fraction of a second, with no fatigue and no loyalty, weighing price alongside availability, ratings, and fulfilment. The consideration set is no longer three. It is every product the system can match to the request.
The infrastructure making this real is already live at scale. Google’s Universal Cart, launched at Google I/O 2026, works across Search, Gemini, YouTube, and Gmail, and once a shopper adds a product it tracks price drops and better deals across merchants continuously, on its own. Google Shopping data feeds the wider ecosystem too: a Search Engine Land analysis of 43,000 products in March 2026 found that 83% of the products in ChatGPT’s shopping carousels matched Google Shopping’s top organic listings, and ChatGPT Shopping reaches roughly 900 million weekly users on a recommendation engine no one can pay into.
Inside retailer ecosystems the same expansion is underway, with Walmart’s Sparky live in the app and inside ChatGPT, and Amazon’s Alexa for Shopping relaunched in May 2026 across a quarter of a billion users. Every one of these surfaces is comparing prices across a field far wider than any pricing team’s tracking list..
In this context, showing up means making your view of the market as wide as the view the machine uses to judge you.
But width is a trap on its own. A wider competitive picture only helps if every comparison inside it is correct, and the moment you widen the field, the thing that quietly decides whether any of it is usable is whether each product was matched to the right competitor in the first place.
The Cost of a Bad Match Is Higher Now Than It Has Ever Been
Every competitive price comparison rests on one operation that happens before any pricing decision is made: matching your product to the right competitor product. Your 32-ounce bottle to their 32-ounce bottle. Your mid-rise straight-leg jean to a comparable one, not to a different cut at a different price tier. When the match is right, the comparison reflects reality. When it is wrong, every number built on top of it is wrong, and confidently so.
A bad match produces a bad benchmark, and that benchmark now feeds discovery directly. Match your product to a cheaper, non-equivalent competitor and your intelligence tells you to cut a price that was already competitive, and you leak margin where every point counts. Match it to a more expensive non-equivalent and you look overpriced against a phantom, and the system surfaces a rival instead of you. Either way the error shows up where the buyer journey now begins, in whether you get shown at all.
What Makes Matching Hard, in Practice
Matching sounds simple until you look at real listings. It is not one problem, and the approaches most teams reach for first break on contact with how messy retail data is. A few examples make the point.
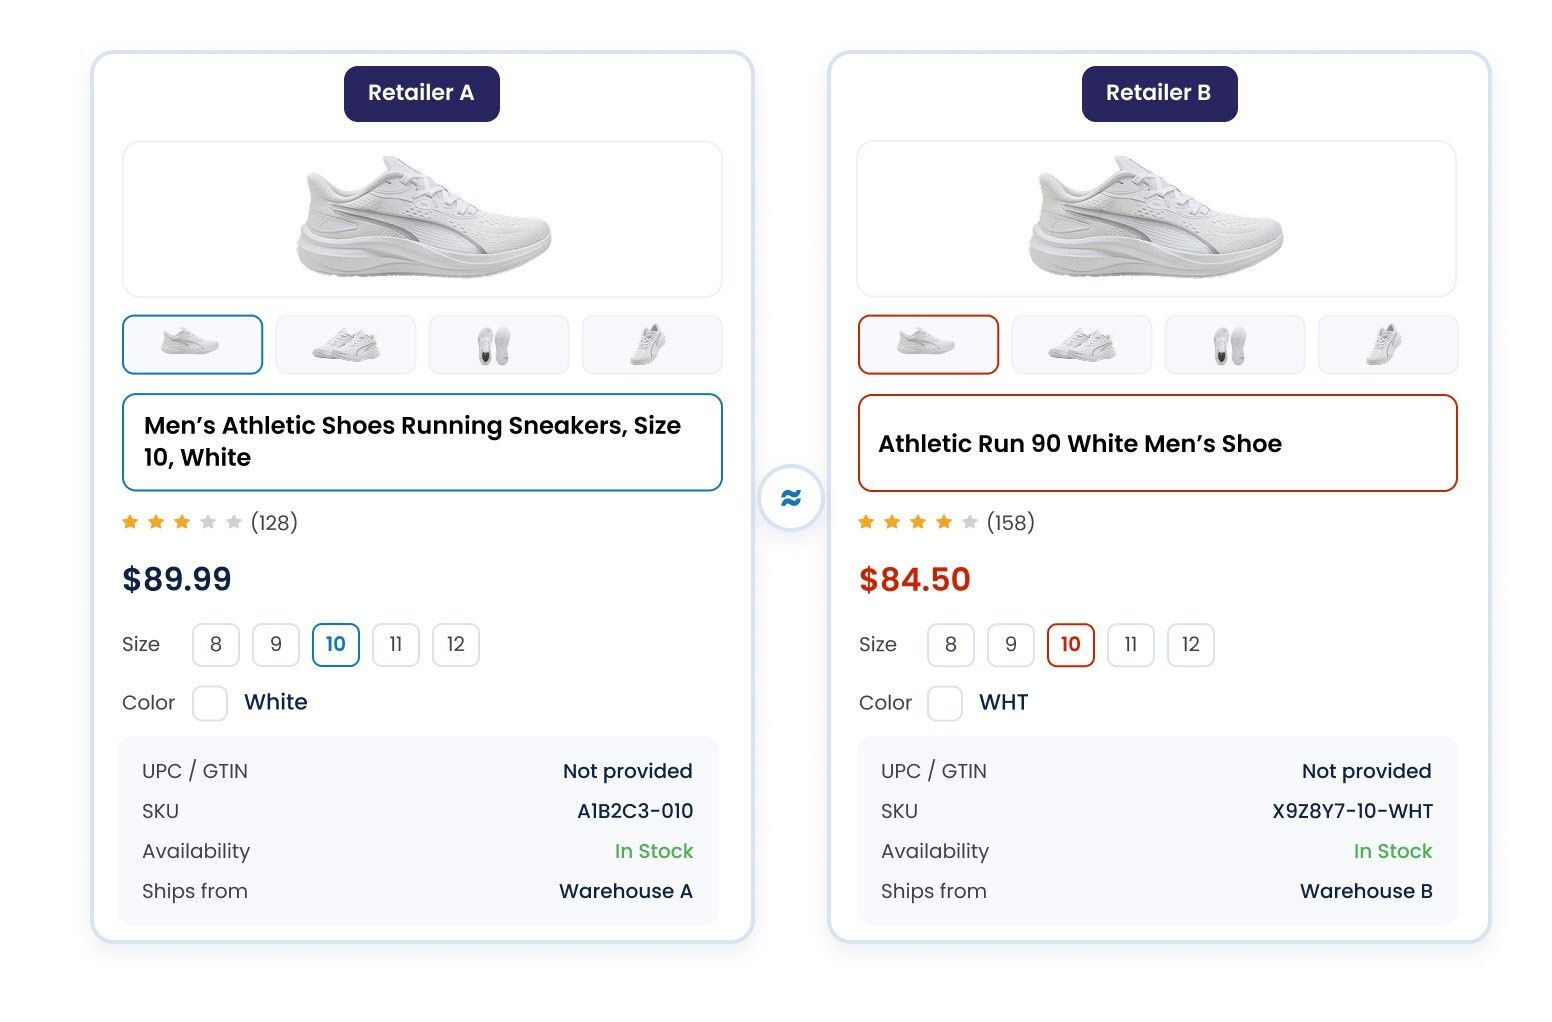
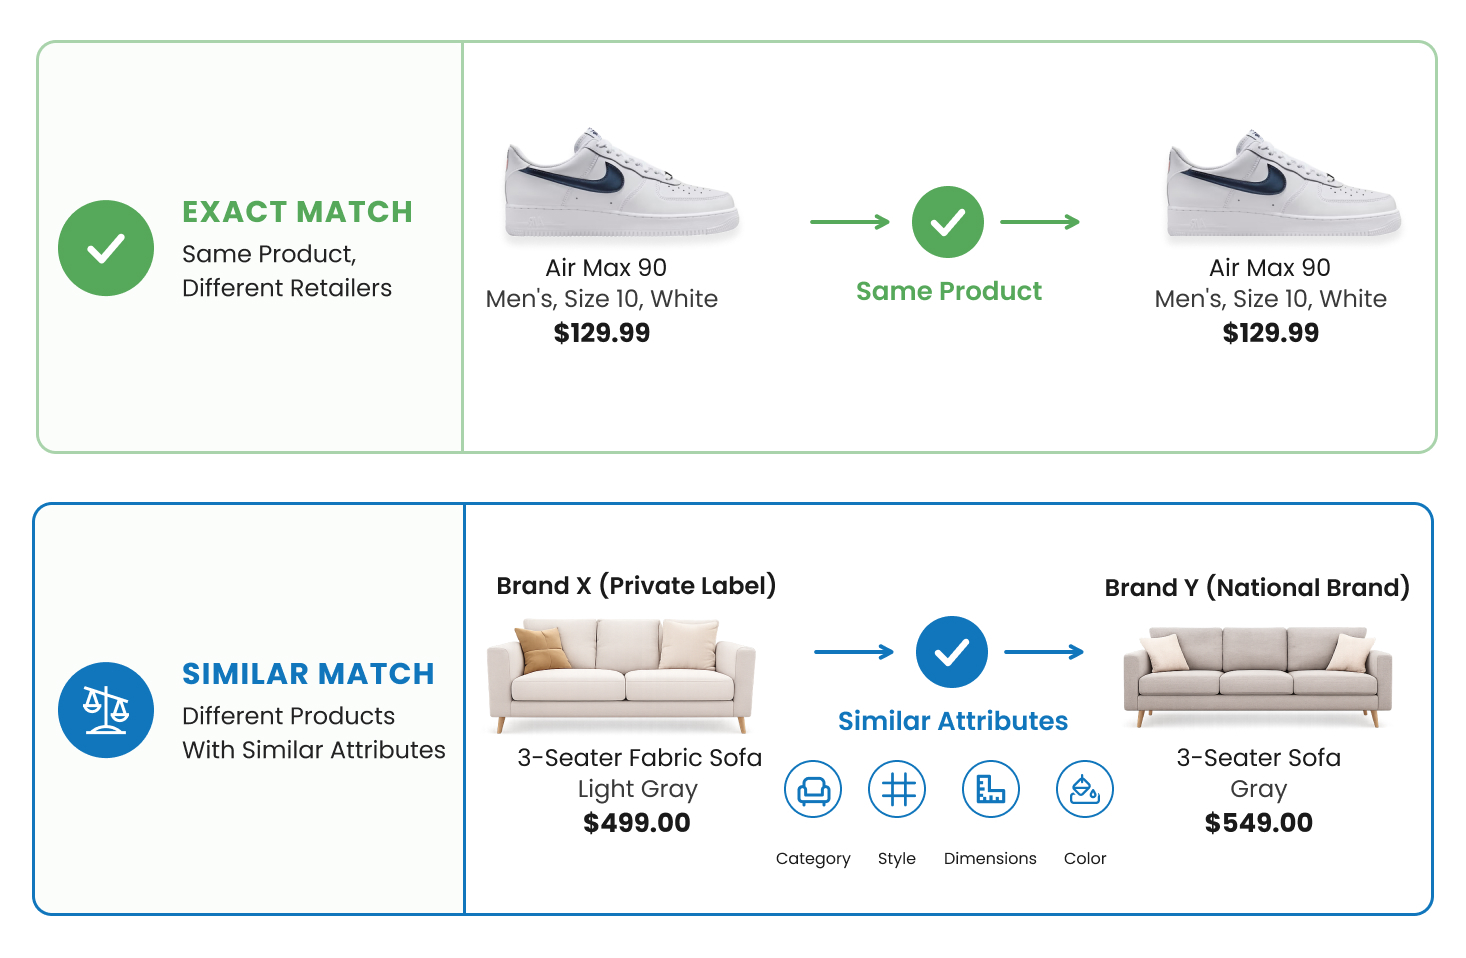
The same product, described two completely different ways. A shoe shows up as “Nike Air Max 90, Men’s, Size 10, White” on one site and “NIKE AIRMAX90 WHT MEN SZ10” on another. Matching on UPC or GTIN works when the codes are present and consistent, and misses a large share of the catalogue when they are not, which is often, because retailers omit identifiers, use internal SKUs, and sell regional variants without barcodes. Matching on title strings is just as brittle, because the same product is written up differently everywhere and unrelated products share words that look meaningful.
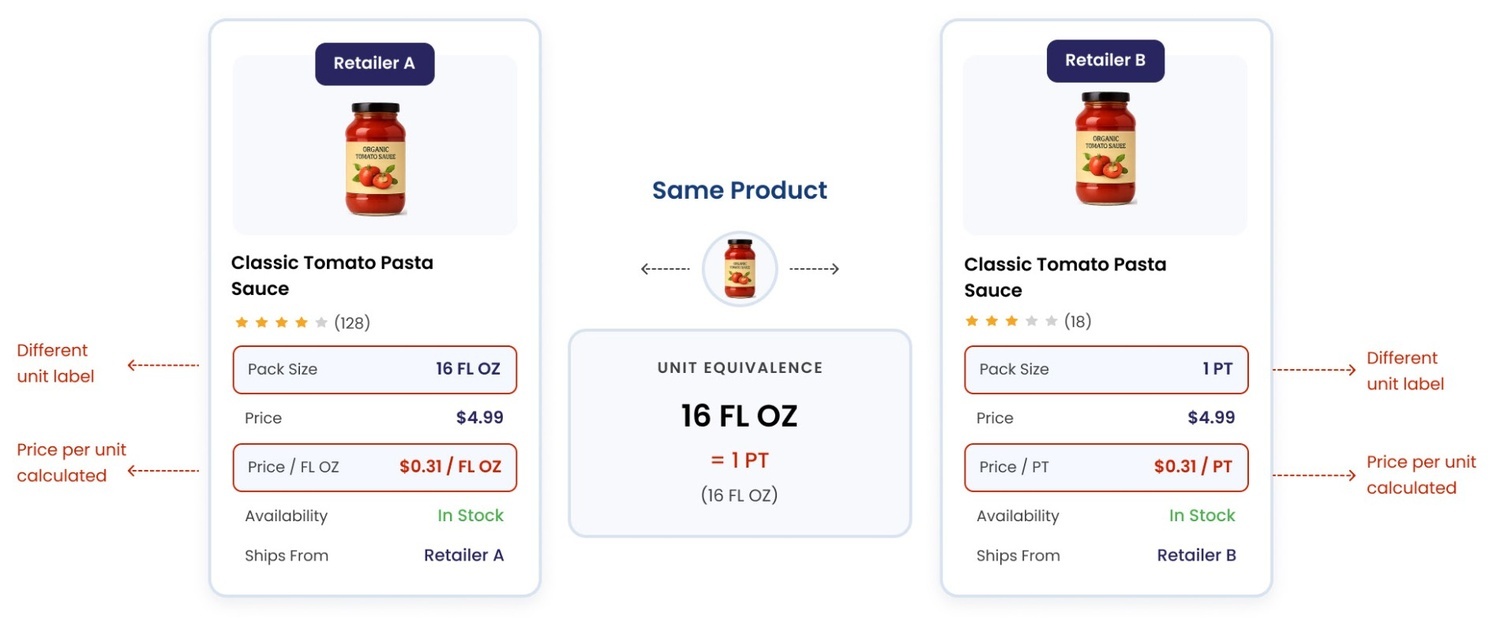
The same product, sold in a different pack size or unit. A 16-ounce bottle is listed as “16 FL OZ” on one feed and “1 PT” on another. A grocery item sells in a 32-ounce jar on your shelf and a 24-ounce jar on a competitor’s. Without unit-of-measure normalisation, a comparison between them is not merely imprecise, it is meaningless, and it will quietly recommend the wrong move.
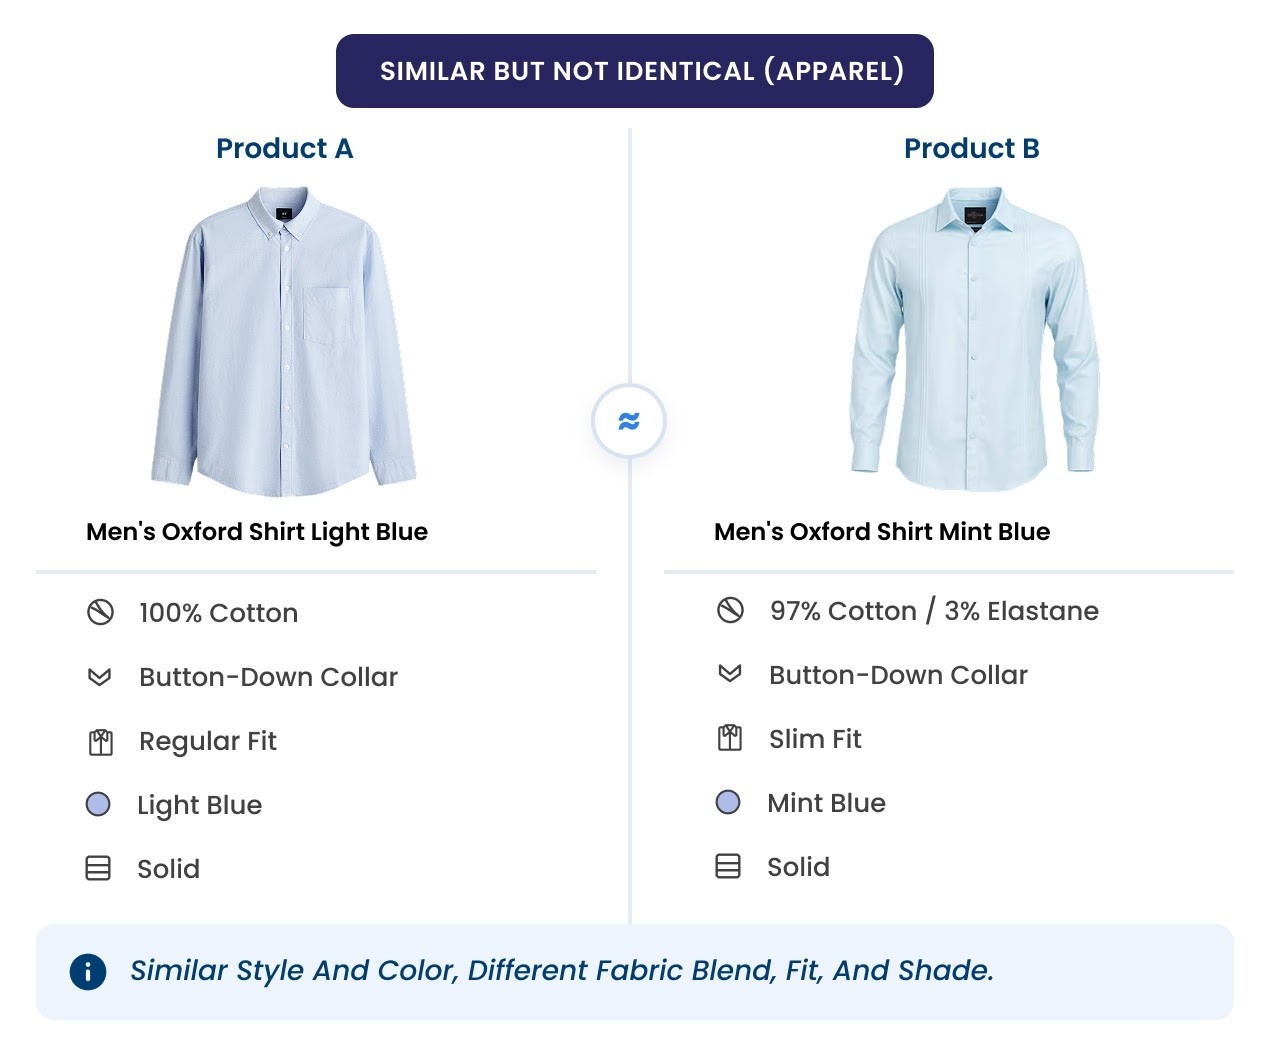
A private label similar to the national brand, or “similar” products that are not quite the same. Retailers title their private label to mimic name brands, and in apparel, furniture, and home improvement no two competing products are ever truly identical. A match here turns on judgement that shifts by category: style, colour, fabric, and fit in apparel; coordinated sets rather than single pieces in furniture; exact dimensions in home improvement, where a four-inch fixture and a six-inch one are different products for different jobs, not variants.
Underneath the examples is a structural point. Matching is not one task but several, exact, similar, variant, substitute, competitor, and basket, and it gets harder as you move from categories with clean identifiers, where exact matching can clear 99% accuracy, to apparel and private label, where match rates routinely fall to between 40% and 60%. A system that treats all of them as the same problem produces results that are confidently wrong, the most dangerous output of all, because it looks exactly like data you can trust.
How DataWeave Approaches Matching, and Why It Holds Up Where Others Don’t
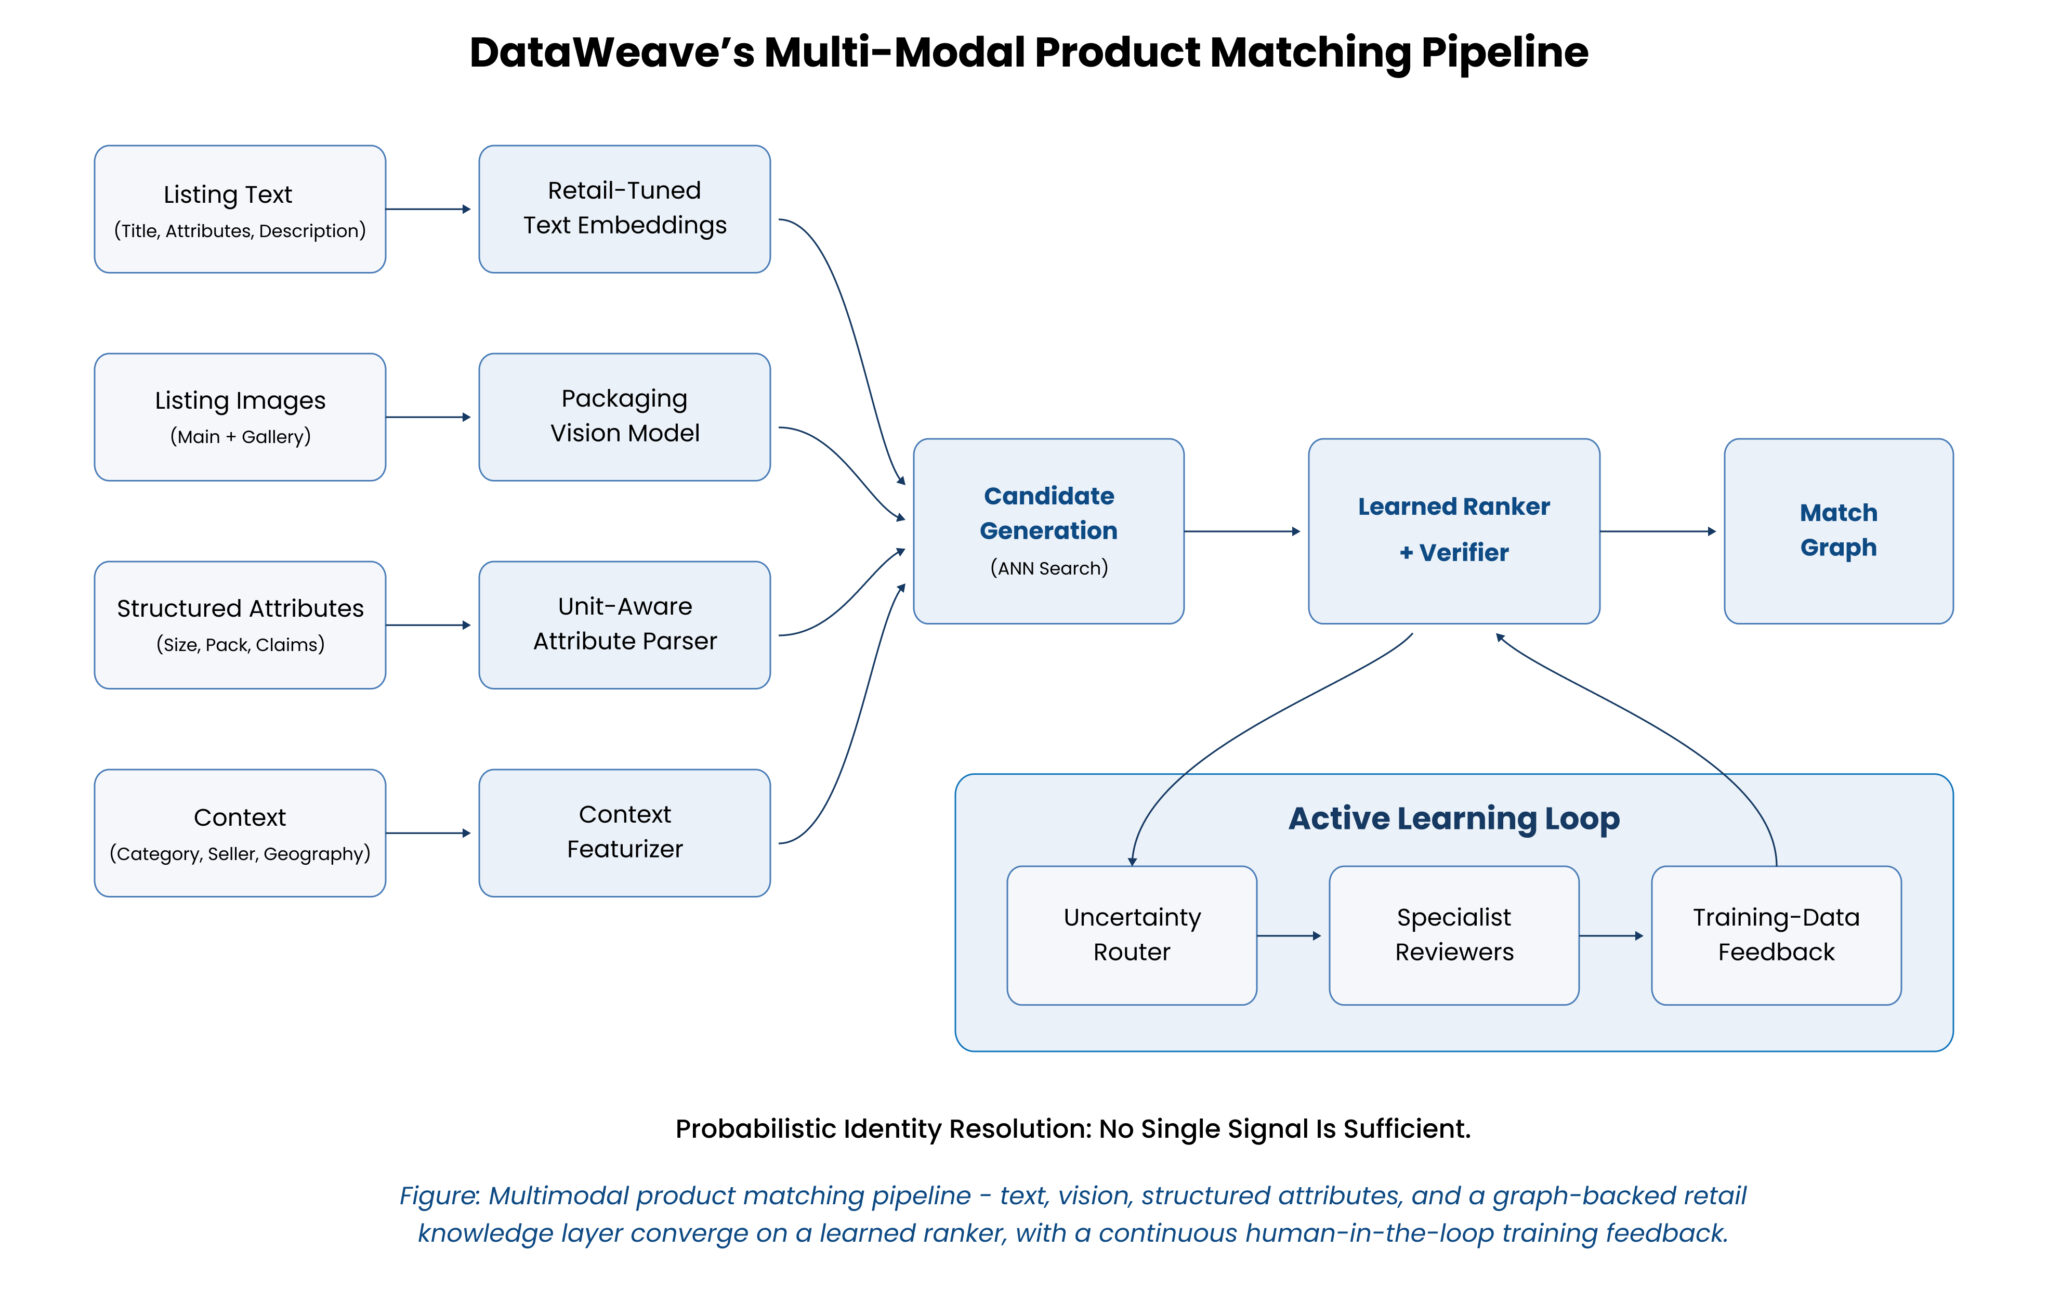
DataWeave’s product matching starts from the premise that UPC and GTIN only take you so far, and that everything difficult and valuable lives beyond them. Rather than leaning on identifiers or title strings, the engine matches the way a domain expert would, reading the product across every signal available and weighing them with retail context built in.
Read every signal, not just the barcode
On the text side, attributes are pulled from messy titles and descriptions, so “Apple iPhone 12 Pro Max 128GB Pacific Blue Unlocked” decomposes into brand, product family, storage, colour, and carrier status, then normalised so “RAM” and “Memory” resolve to the same attribute and “P&G” unifies with “Procter & Gamble.” This knowledge lives in a continuously updated graph of relationships between products, brands, and attributes, not a static lookup file. On the image side, the engine pre-processes product photos and uses visual feature extraction and CLIP embeddings to compare products shot under different lighting, poses, and backgrounds, across a library of more than 100 million indexed images. Text and image reasoning run together, which is what makes similar matching possible where titles alone are hopeless and identifiers do not exist.
Match each type by its own logic
Exact, similar, variant, substitute, competitor, and basket matches each get the logic appropriate to them, with similarity criteria and tolerance thresholds configurable by vertical, so a “similar” jean for competitive pricing is defined differently from a “similar” recessed light fixture.
Keep experts in the loop where it counts
Close to 90% of matches are auto-processed, verified at high confidence or rejected when clearly not a match, and the ambiguous cases route to specialist reviewers through Veracite, DataWeave’s human-in-the-loop layer. Every decision becomes a new training example, which is how the platform has built a reusable base of more than 40 million verified product pairs that keeps lifting accuracy over time.
Output comes with full transparency into match rates, miss rates, and accuracy, so a pricing team can see how much of their competitive picture is solid and where it thins out rather than trusting a black box. Across categories, retailers, and formats, this is what gets matching to 99%-plus accuracy with under 1% misses, including in the verticals where identifier-based approaches quietly give up.
Pricing Intelligence Has the Same Goal and a Bigger Job
The goal of competitive pricing intelligence has not entirely moved. It is still to make sure your price is working in your favour at the moment a purchase is decided. What moved is where that moment sits and who is present for it. The decision now starts earlier, before the shopper has seen you, and it is mediated by a system comparing you against the entire market rather than the few names a person would have checked.
That puts price inside a bigger picture. Getting surfaced by these systems takes three things working together. The product has to be available and in stock, which is where Assortment Analytics earns its place, keeping you present and well distributed across the market the machine is reading.
Next, it has to carry the right content, structured so a system can understand and trust it, a discipline of its own that we cover in the retrieval economy and that Content Optimization is built to manage at scale.
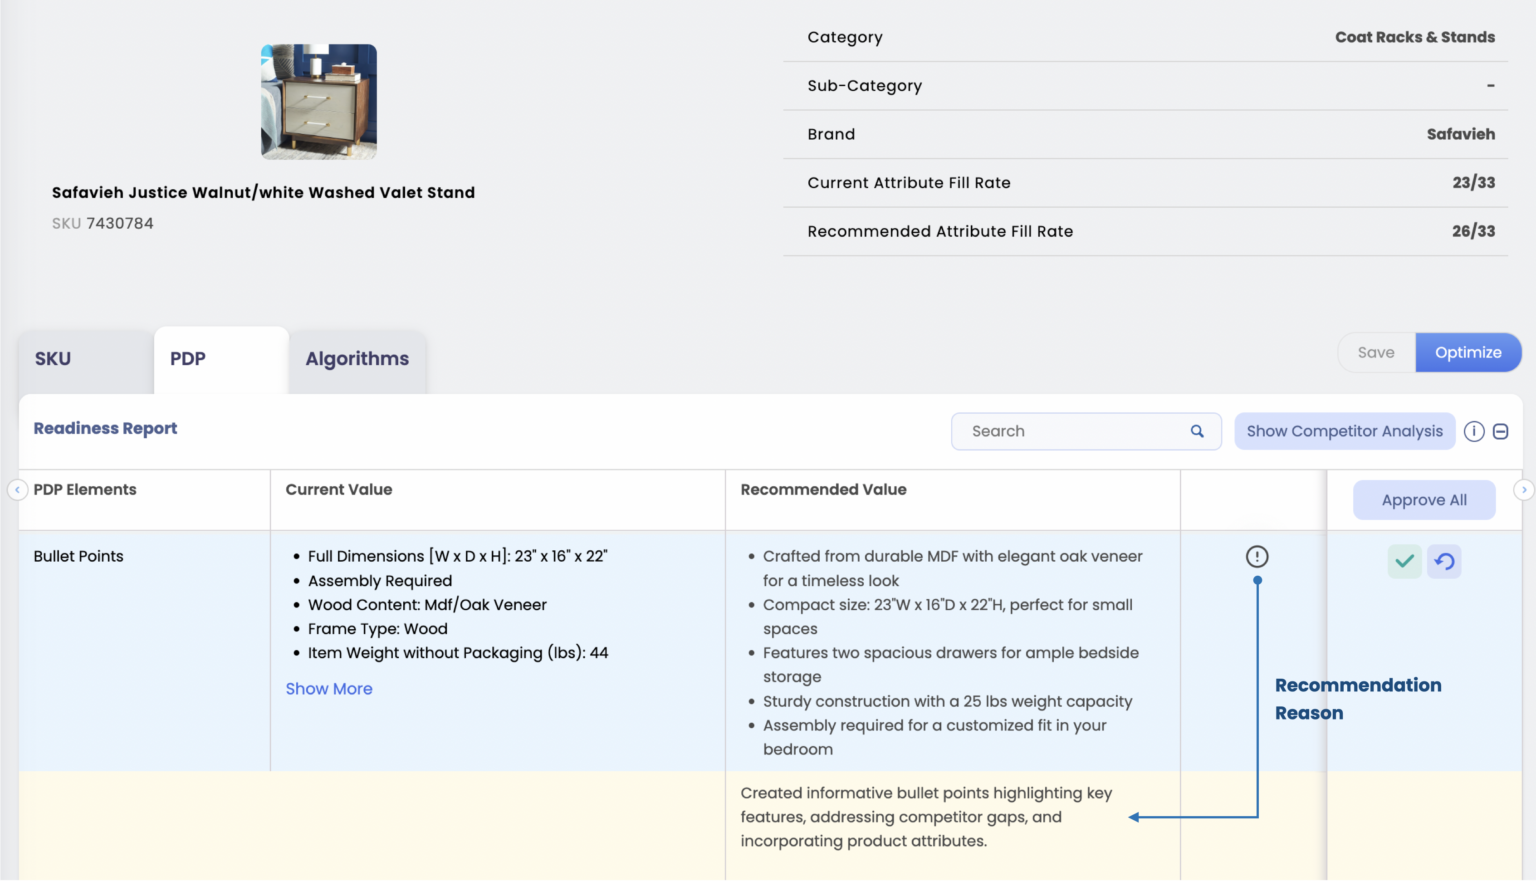
And, lastly, it has to be competitively priced, which is the job of Pricing Intelligence. Miss any one and the other two cannot save it. A perfect price on an out-of-stock product is invisible, and a keen price on a thinly described one rarely gets understood well enough to be recommended.
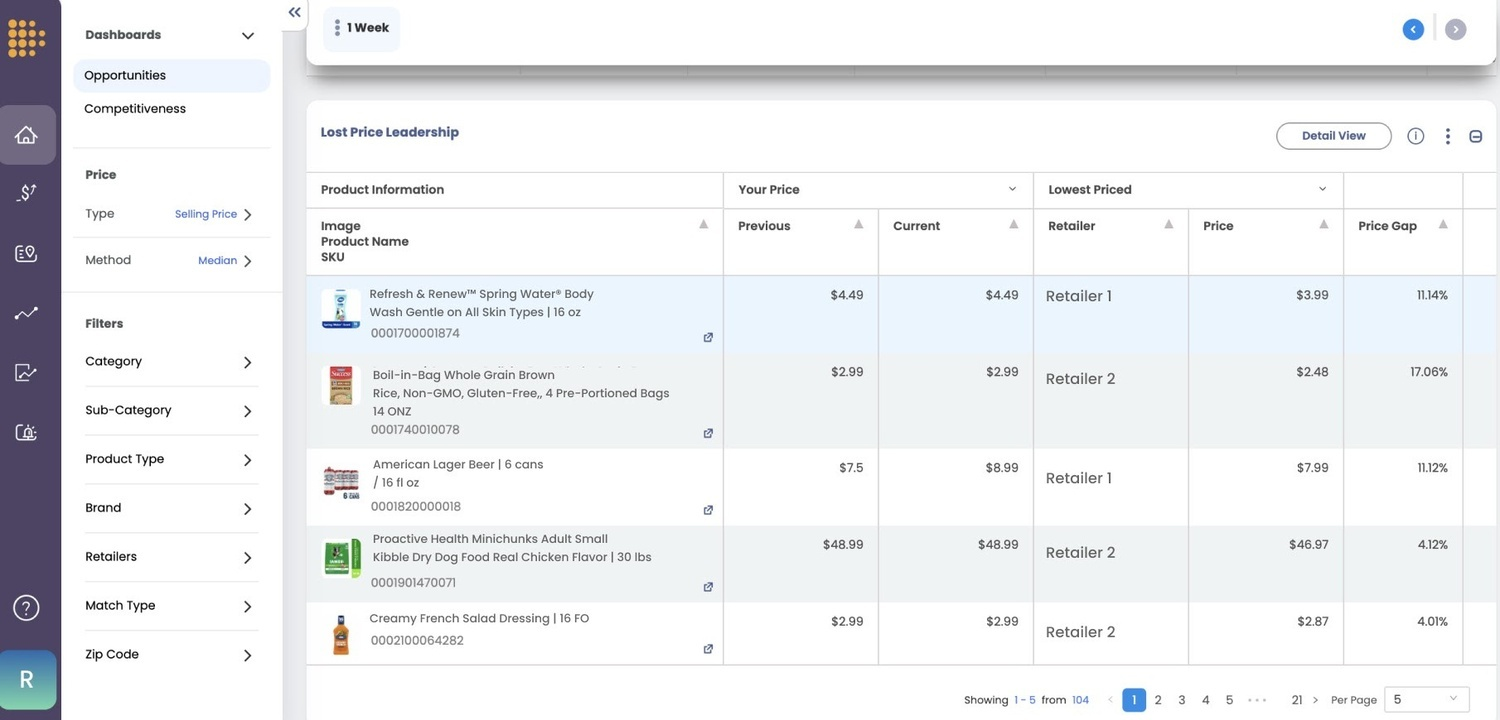
Your competitive picture has to be as wide as the field the machine uses to judge you, and every comparison inside it has to rest on an accurate match, because at this scale a wrong match does not just mislead a benchmark.
It removes you from the consideration set or quietly bleeds your margin, invisibly. Width without accurate matching is just a larger pile of wrong comparisons. Accurate matching across a wide field is what lets your price do the job it has always had, now that the shopper has handed the comparison to a machine that sees everything. Reach out to us today to see how your competitive pricing holds up across the field the machines are actually using.


Book a Demo
Login
For accounts configured with Google ID, use Google login on top.
For accounts using SSO Services, use the button marked "Single Sign-on".